Zombies!
Happy President’s Day! Here in NYC we have the entire week off #sorrynotsorry for those of you who don’t. I get it, my hubs only has today off and then back to work!
I am grateful for this time off because it is giving me a moment to update this blog and add listings to my TPT page. This year was my first time trying to maintain a blog, Instagram, Pinterest and TP T page while also working full time as a teacher/coach in a school that is working really hard to improve- and naturally, it has been tough! But my new goal is to post on here at least twice a month with something useful for other teachers to use. Here goes!
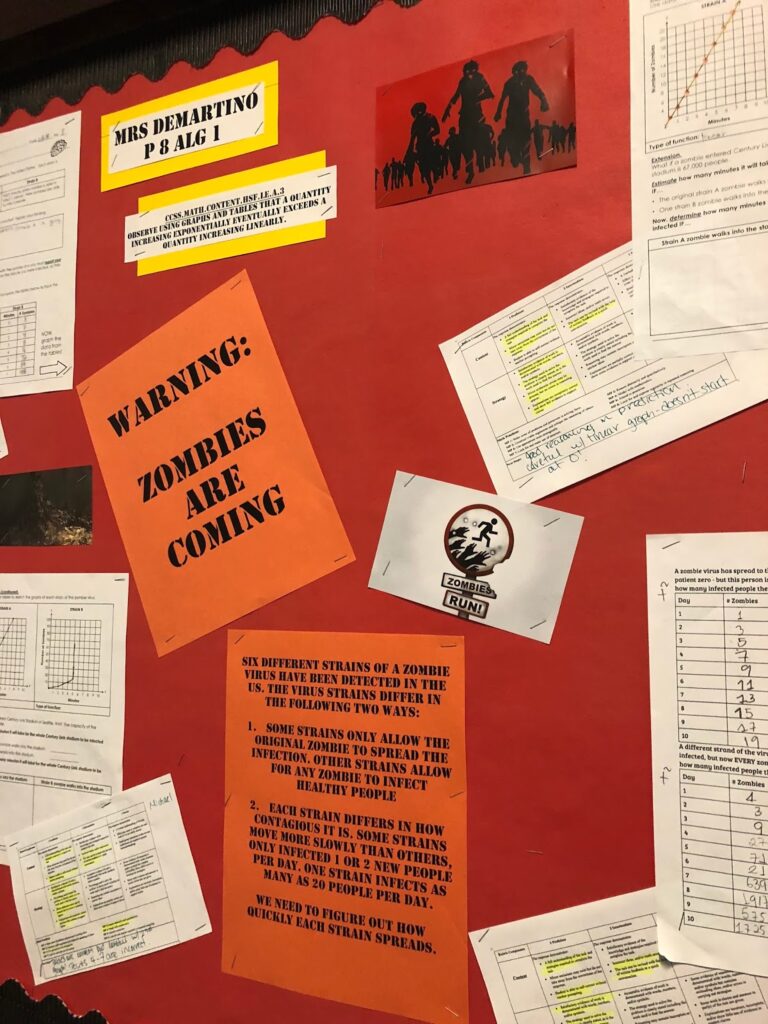
Just before break, my Algebra 1 students did a 2 week quick unit on Exponential functions. I always knew I wanted to so a project to tie in epidemiology with exponential growth at some point in that unit, but I couldn’t decide if it should go at the beginning, middle or end. I ended up rolling the dice and creating a project that links linear and exponential functions to do on the very first day of my exponential unit. The previous unit was a 2 week review of linear functions, and I thought it made sense to spend a day letting the students see the similarities and differences between these two types of relationships. I also thought starting off with a student-centered mini project about Zombies may get them excited about the new unit. As a bonus, the lesson ended up perfectly aligned to Common Core Standard HSF-LE.A.3.
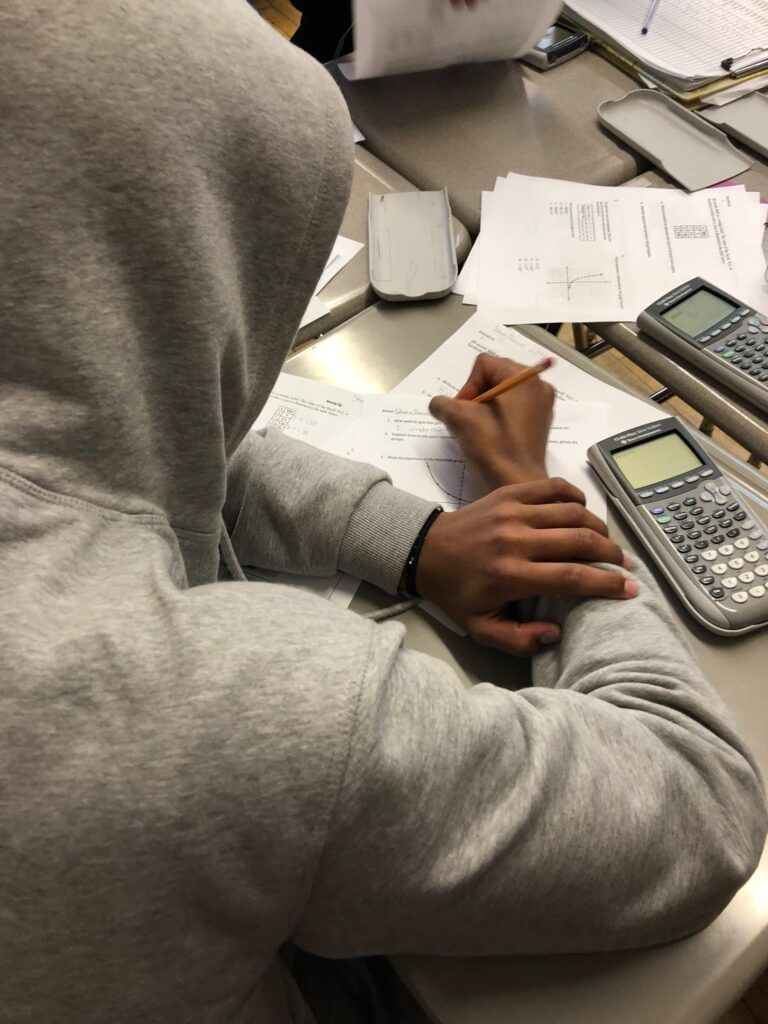
Turns out this assignment was a slam dunk! Not only were my kids super psyched to talk about diseases and zombies and world destruction, this project tapped into a well of curiosity they had about biology, patterns, epidemiology, and more. I was blown away by the engagement and depth of questions, both about math and not, that all of my students asked me during this class and even in the days to follow. This led to, as I had hoped, an increased enthusiasm for the more traditional lessons on exponential functions that came in the following days. See, look how engaged my normally most disengaged kiddo is!
I posted the full assignment to my TPT page here. I also put together a bundle of both this project and the following 4 days of lessons – guided notes, practice and a quiz – that I posted here. Basically the project went like this:
- Warm Up: I propose 2 hypothetical offers of extra credit to my students, one that starts at a measly .01 points and doubles every day, and another that starts at 1 pt and adds 1 pt per day. Kids have to write down which they would choose and why.
After the Warm Up, I chose to let the kids have a quick little debate about their choices but not say who was right. Just when they started to get really into it, I said let’s pause and figure it out. This isn’t an open-ended question, there is a way to figure out which is a better deal so let’s just go ahead and do the math that will resolve this debate. The kids seemed almost taken aback by that statement, like they had forgotten that the beauty of math is we CAN figure out the right answer, and we don’t have to engage in back-and-forth debates about what we think forevermore. Sigh. There’s something so beautiful about that, isn’t there?
- Exploration 1: Students fill in two tables, one for each extra credit option, that lists the day’s total and the cumulative total points earned for days 1 – 14. I filled out the first 2 rows already. In one class, that was enough support to get the kids started. In the other, I had to model how to figure out row 3 out loud at the front of the class before kids were able to start on their own. They filled out up to day 14 for both examples, and were told to let me check their work before they moved on.
I let my kids work on these in tables but each had their own papers. You could do the same, or have this be a totally solo activity, or have it be a group or pair activity with just one sheet. After they are done, they can see that even though the first offer started off with 1/100th of a point compared to a full point, it quickly outpaced the other offer. As a bonus extension, I asked some kids to name the types of relationships the two tables showed. Many of them were able to say linear and exponential. As a further extension, you could ask kids to try to write the equations.
- Exploration 2 Table: Now comes the zombies. I wanted students to see just how out of control big exponential growth can make numbers, and how quickly it can happen, so in the zombie part of the assignment both scenarios start with one zombie. In the linear scenario, which I called virus 1, only the original zombie can infect, and he infects 2 people per day. In the exponential scenario, or virus 2, we also start with 1 zombie and have an infection rate of 2 people per day – but in this case, every zombie infects 2 more people per day, not just the first zombie. As you will quickly see when you work this out, the exponential outpaces the linear in this case immediately and the exponential numbers, as it is x3, get huge fast. This actually led to a good talk about what it means when the calculator writes E#, which is how the TI84 and TI83 write huge numbers in scientific notation.
- Exploration 2 Graph: Lastly, students had to graph as many points as they could fit from the previous page’s tables on the same grid. After stressing out about how I couldn’t fit a coordinate grid big enough to show much of virus 2 on one sheet of paper, I realized that was actually fine. The fact that students can hardly fit any of table 2 onto a graph that also houses table 1 helps students to see just how much bigger the exponential graph really is.
This part of the lesson also led to good talks about scales. Some kids just tried to add the numbers they needed in the y-axis to show a point or two more from virus 2 without paying attention to maintaining the scale. We had a good talk about how that is misleading and incorrect, and that they are better off not graphing every point than graphing points wrong.
- Extension & Closing Questions: Finally, I had students fill out a table guessing how long it would take for certain regions (NYC, USA, North America, etc.) to become totally infected with the zombie virus under each virus strain. Students worked backwards, extending their tables from the previous pages until they hit the population numbers. This was a good application of the time-tested strategy of guess-and-check of which some of my kids are usually so skeptical. Lastly, I finished out with 3 closing questions that ask students to reflect on the big ideas of the day.
![]()